A collection of work by Sydney Hill

Transforming raw backend data into actionable insight for smarter business decisions
TLDR
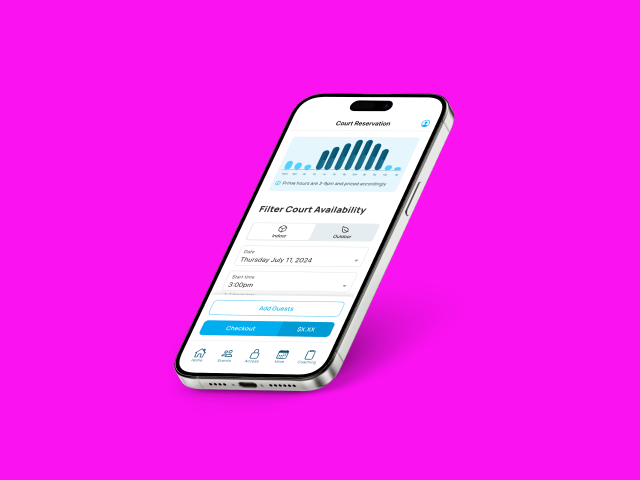
To help Passive Investing monitor the success of their new franchise venture, I built a real-time business metrics dashboard for 24 Hour Pickleball. I designed a flexible, fluent service and facade architecture in Laravel that made it easy to calculate over 20 different KPIs across multiple models—like memberships, revenue, and daily facility usage. Using a chainable syntax, the system allows developers to compose complex queries in a readable, scalable way. The final dashboard gave stakeholders instant visibility into how their investment was performing.
Imagine you're opening a new 24 Hour Pickleball facility, managed largely through an internal application. Your team has built a Laravel-powered admin dashboard that houses all data relating to the business, facility, and customers. But something is missing: a high-level overview of key business metrics like profit, new memberships, daily visitors, and month-over-month growth.
Our team built a dashboard to display over 20 different business metrics in real-time.To support stakeholders in making informed decisions, we needed to build a scalable dashboard module capable of displaying over 20 real-time business metrics.
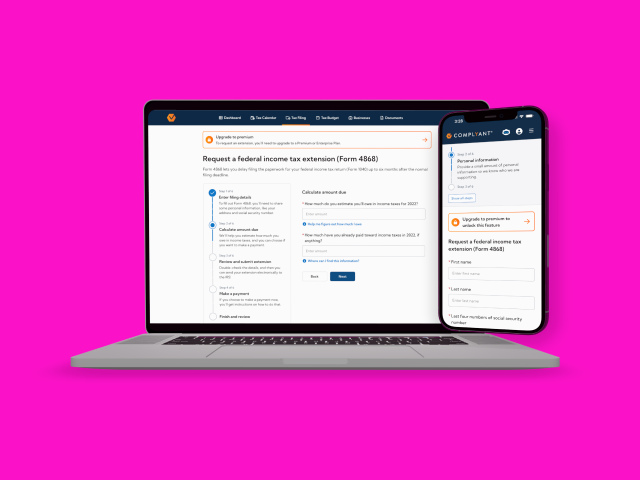
Our internal system includes both a mobile app built with Ionic and an admin dashboard powered by Laravel. For the admin experience, stakeholders requested a rich set of real-time business insights—many of which required calculated, relational, and time-based data transformations.
To handle this complexity in a maintainable way, I designed and implemented a dedicated Stat service layer. I created a fluent, chainable API that made composing metric logic feel intuitive and sentence-like:
const monthGoldMemberships = count()
    ->forPlan(MembershipLevel $membershipLevel)
    ->byMonth(int|string $month, int|string|null $year = null);
The fluent structure leverages Laravel's query builder under the hood, balancing power with readability. I focused on making the API approachable and easy for other developers to pick up quickly.
I also referenced the full set of stakeholder-requested metrics to drive test coverage using Pest, ensuring accuracy and regression safety from day one.
The metric dashboard was fully implemented, tested, and successfully deployed to production. Stakeholders now have access to a comprehensive, real-time snapshot of business health. The modular Stat service has already proved valuable in other areas of the codebase, and has made expanding the dashboard a straightforward task.
This work not only delivered immediate value to the business, but also laid the foundation for future data-driven features across the platform.
Tools and Tech Stack
Design
Frontend
Backend
Build Tools
Testing
Workflow
Coming soon.